Technical SEO
Why rendering audits begin in the wrong place
A five-stage method for separating access, response, HTML, rendering and indexing faults before JavaScript receives the blame.
Rendering issues are real, although they often receive the blame for faults that happen somewhere else in the search process.
A missing product description might come from a blocked API, but it could just as easily come from a server error, an empty page template or a noindex rule. A page can also render perfectly and still remain outside the index. If every one of these cases is labelled a rendering problem, the investigation begins in the wrong place. A better approach is to check the page in the same order that a crawler encounters it.
Rendering is one stage, not the whole audit
Google describes search as crawling, rendering and indexing. That broad model is helpful, but it hides several earlier checks that matter during an audit. A request can be blocked, redirected or served the wrong HTML before JavaScript gets a chance to run.
Googlebot checks robots.txt before requesting a URL. If access is allowed, it receives the HTTP response and source HTML before the page can enter the rendering queue. Google processes the rendered HTML later as part of its indexing checks, while a robots rule can still prevent indexing. The current JavaScript SEO guidance sets out this sequence.
Bingbot renders pages with an evergreen version of Microsoft Edge, which is updated often according to its crawler documentation. Modern browser support helps, but it doesn’t make server responses or resource access any less important.
A browser screenshot only shows one part of the journey. It can’t prove that a crawler received the same response or HTML, and it tells you nothing about whether the page was later chosen for indexing.
The five-gate rendering audit
Think of the audit as five gates. Each one answers a different question, and the first failed gate tells you where to look next.
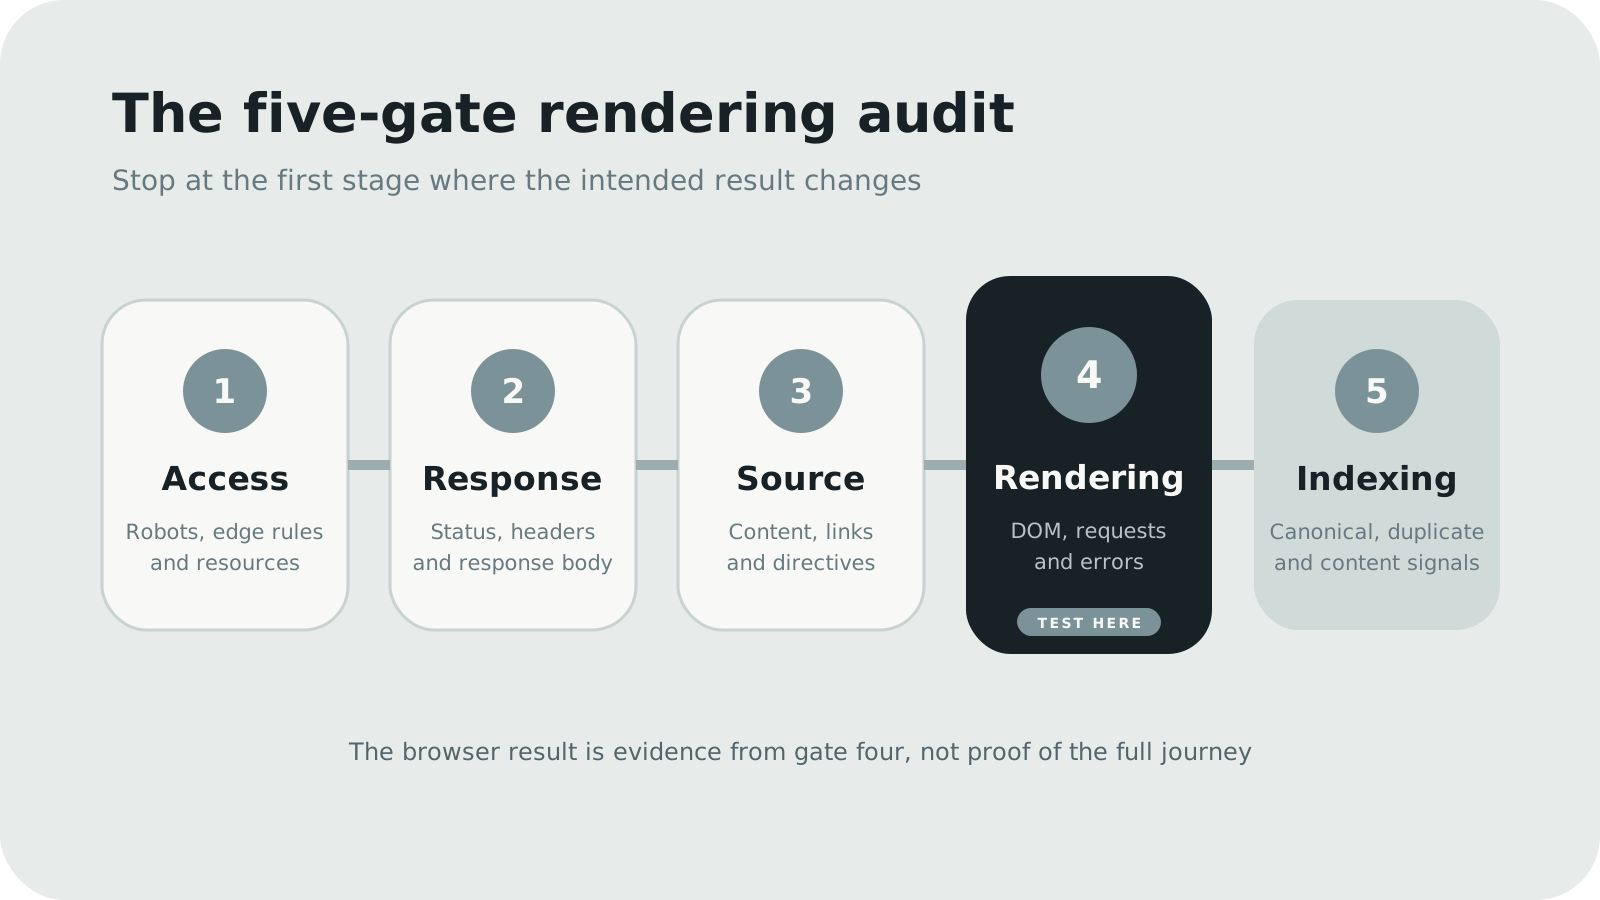
Gate 1: access
Start by confirming that a crawler can reach the URL, then check the resources needed to build the main content.
Check the live robots.txt file rather than a saved copy, then review CDN, firewall and bot rules. robots.txt may allow a request while the edge still returns a challenge, timeout or 403 response.
Test more than the page URL because JavaScript, CSS and API endpoints can follow different rules. Google can’t use a blocked script to build the page, while your own browser may work because it carries different cookies, headers and network history.
How to check access
You can run the first check in a browser by opening /robots.txt on the live domain. Search for the affected path and any important script or API folders. Then use Chrome DevTools in a private window to reload the page without an existing session. The Network panel will show requests that were blocked, challenged or returned an error.
If you manage the CDN, inspect its security events and request logs too. Look for verified crawler requests and compare their responses with a normal browser request. This helps separate a genuine access problem from an issue that only affects your own test.
Useful evidence includes:
- a direct request made without stored cookies;
- server or CDN logs showing a verified crawler request;
- the live
robots.txtresponse; - a comparison of responses across user agents;
- failed or challenged requests for important assets.
If access fails here, you haven’t found a rendering problem. The renderer never received what it needed.
Gate 2: response
Next, inspect the first HTTP response. In plain English, this is the package the server sends back before the browser changes anything. Record its status code, redirect chain, headers, response time and final URL.
Google can pass a 200 response into later steps, although that doesn’t guarantee indexing. Persistent 4xx responses stop the returned content from being used. Repeated 5xx responses can slow crawling and may cause indexed URLs to be removed. Google’s crawler response guidance explains how each status group is handled.
The status alone isn’t enough. A 200 response can still contain an error page, empty shell or login message, which search systems may treat as a soft 404. A redirect can also land on the wrong locale, device version or canonical URL.
Save the response body alongside the status. This small step stops a healthy-looking 200 from ending the audit too early.
How to check the response
Chrome DevTools provides a straightforward first check. Open the Network panel, reload the URL and select the initial document request. Record its status, final URL, response headers and response body. The Redirect Path browser extension or a command-line request with curl -I can make longer redirect chains easier to review.
Test the URL in a private window as well as your normal browser. If the two responses differ, a cookie, login state, cache or personalisation rule may be changing what the server returns.
Gate 3: source HTML
Now read the HTML returned by the server before JavaScript changes it. This is the source HTML.
Look for the main content, title, meta description, canonical link, robots directives and ordinary HTML links. Note what’s complete, what’s only a placeholder and what’s missing. You don’t need every element to be present at this stage, but you do need to know what depends on JavaScript.
Server-rendered or static HTML reduces the number of systems that must work before important content becomes visible. Google still renders successful pages, but it doesn’t need that step to find text and links already present in the response.
Source HTML can reveal faults that a browser hides. Common examples include:
- JavaScript later replaces the canonical URL.
- The response contains an initial
noindexrule. - An API failure leaves an empty app shell.
- Navigation lacks crawlable
hreflinks. - A cache inserts data from the wrong page.
- Error copy arrives with a successful status.
Canonical signals need particular care. Google advises setting the canonical in the source HTML and keeping it stable after rendering because conflicting values can produce unexpected results. Its canonical guidance explains the available signals and their relative strength.
How to check the source HTML
Use the browser’s ‘View page source’ option for this check, not the Elements panel. View source shows the response before JavaScript changes it, while Elements shows the working DOM after scripts have run. Search the source for the page title, canonical URL, robots directive, a sentence from the main content and key internal links.
For larger checks, Screaming Frog’s JavaScript settings let you compare the original and rendered HTML across many URLs. You don’t need a full crawl to diagnose one page, but the comparison becomes useful when the same fault affects a template.
Gate 4: rendered output
Rendering becomes the main suspect only after the first three gates have passed. At this point, compare the source HTML with the rendered DOM rather than relying on a screenshot. The DOM is the browser’s working version of the page after scripts have had a chance to change it.
Record what JavaScript added, removed or changed. Then check the browser console and network log for failed requests, blocked resources and slow tasks. Chrome’s network inspection guide explains how to review request status, timing, causes and response data.
Rendering faults often fall into a small set of patterns:
- The main bundle fails before content is inserted.
- An API returns no data, an error or data for the wrong user.
- Content needs a click, scroll or consent state that a crawler won’t reproduce.
- A route works during client navigation but fails on a fresh request.
- JavaScript removes a canonical or robots rule from the source.
- An unsupported browser feature stops the application.
- Slow resources leave key content outside the rendered result.
Use Search Console’s URL Inspection tool or the Rich Results Test to compare your browser result with Google’s rendered HTML. Google recommends both in its rendering troubleshooting process. The aim isn’t simply to prove that JavaScript ran. It’s to find the first meaningful difference between what the server supplied and what Google could use.
How to check the rendered output
Start locally with Chrome DevTools. Open the Elements panel after the page has loaded and search for the same content, canonical and robots values you checked in the source. Use the Console panel for script errors and the Network panel for failed API, JavaScript and CSS requests.
Then run the live URL through Google’s Rich Results Test and inspect the rendered HTML and screenshot. Search Console’s URL Inspection tool is the stronger option for an indexed property because it also shows crawl and indexing information. Compare those results with your browser rather than treating either one as proof on its own.
Gate 5: indexing
A page that renders correctly hasn’t necessarily passed indexing. Search systems still assess duplication, canonical selection, content and other signals. Google states that indexing isn’t guaranteed after crawling and rendering, and its search processing overview separates these later decisions from rendering.
This distinction matters when the rendered page looks right, yet Search Console reports a different canonical or an exclusion. More rendering tests won’t explain a duplicate page or an indexing decision.
Move the audit towards indexing evidence instead. Compare declared and selected canonicals, internal links, sitemap inclusion, similar content and the history of the URL. Once rendering is known to work, staying at that gate only delays the useful diagnosis.
How to check indexing
Use Search Console’s URL Inspection report to compare the user-declared canonical with Google’s selected canonical, then check the last crawl and indexing status. Search the URL in your XML sitemap and crawl the site with Screaming Frog to see how many internal links point to it. A site: search can provide a quick clue, but it isn’t a reliable replacement for Search Console.
If Google selected another canonical, compare the two pages directly. Look for repeated copy, inconsistent internal links, redirects and canonical tags that point in different directions. These are indexing signals, not signs that JavaScript failed.
Use the source-to-render matrix
A simple comparison can narrow the fault before deeper testing begins.
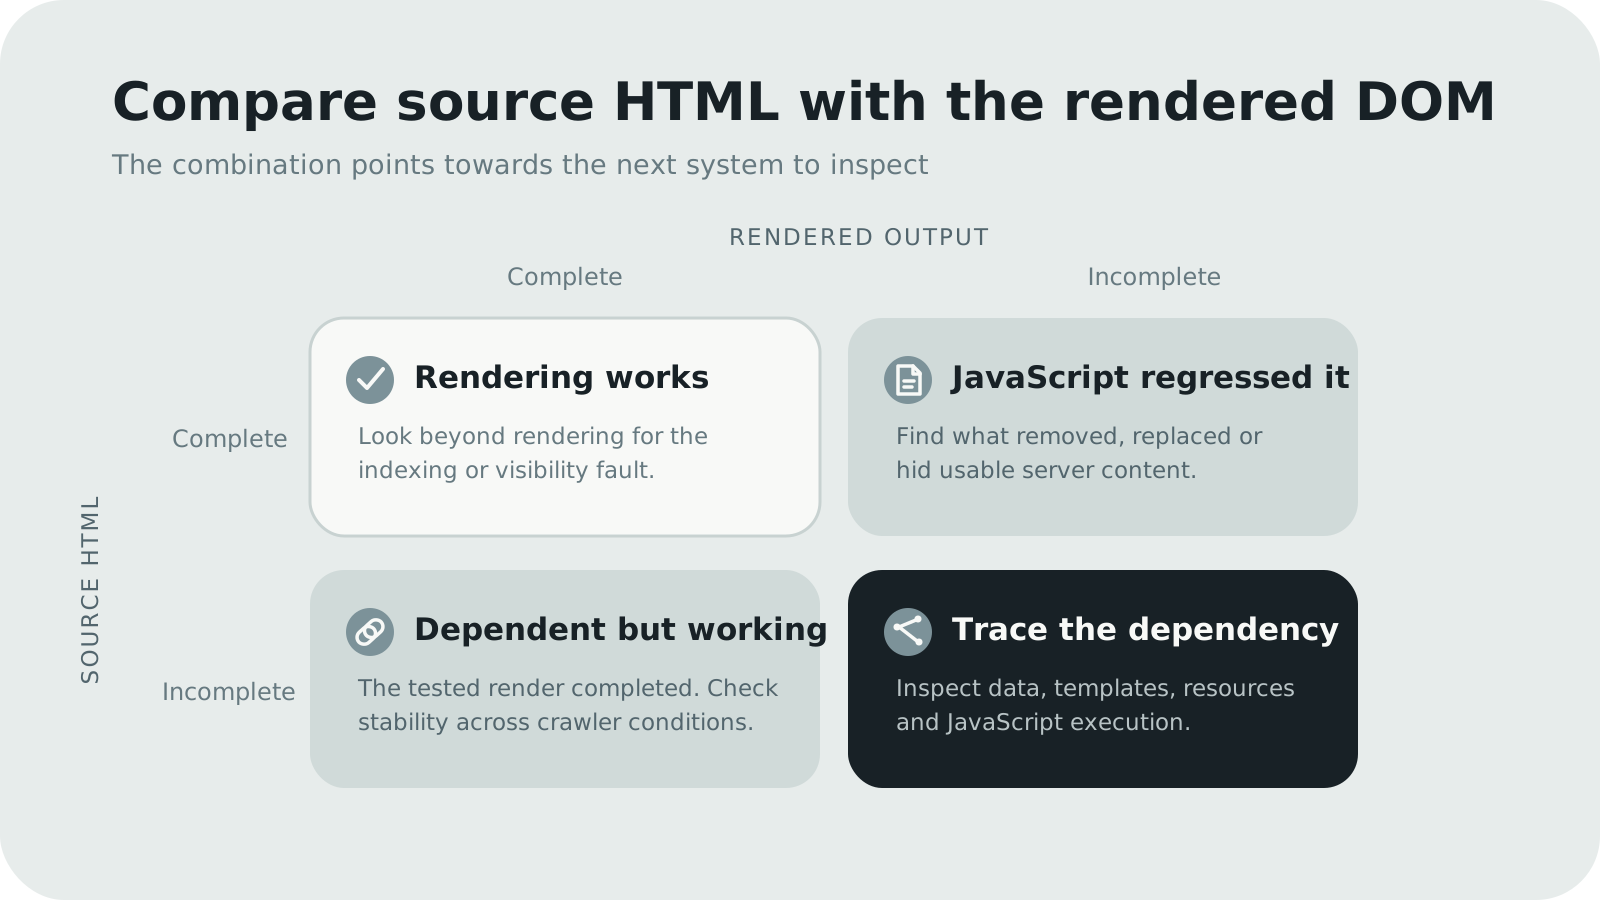
| Source HTML | Rendered output | What it suggests |
|---|---|---|
| Complete | Complete | Rendering is unlikely to explain missing content or indexing. |
| Incomplete | Complete | The page depends on rendering, but the tested render worked. |
| Complete | Incomplete | JavaScript removed, replaced or hid usable server content. |
| Incomplete | Incomplete | Check data, templates, resource delivery and JavaScript execution. |
The matrix doesn’t provide a final cause, but it points towards the next system to inspect. That’s more useful than applying the label ‘JavaScript issue’ to every blank result.
Test in an order that preserves evidence
Start with the least transformed version of the page and move forward:
- Request the URL and save its status, headers and response body.
- Follow the redirect chain and confirm the final URL.
- Inspect the source HTML for content, directives and links.
- Load the page with a clean browser session and record network failures.
- Compare the source with the rendered DOM.
- Test Google’s rendered result and review Search Console evidence.
- Check logs to confirm how verified crawlers were served.
- Review indexing and canonical evidence only after rendering is known to work.
The order matters because opening DevTools first can make the browser result feel like the whole truth. Saving the server response before rendering gives the audit a stable starting point and preserves evidence that later steps may hide.
Separate observation from diagnosis
A useful rendering audit records what happened before naming the cause. This sounds simple, but it prevents a lot of wasted work.
‘Content missing from Google’s rendered HTML’ is an observation. ‘Google can’t render the framework’ is a diagnosis, and it needs further proof.
The same rule applies to indexing. ‘The page isn’t indexed’ doesn’t tell you whether crawling, rendering, canonicalisation or another indexing decision caused the outcome.
Use a short evidence log for each test:
| Field | Example |
|---|---|
| Request | Make a fresh request for the canonical product URL. |
| Observation | The API returned 403 without the browser session cookie. |
| Scope | The product description and stock state were absent. |
| Likely stage | Check access or the response. |
| Next test | Check the edge rule and verified crawler logs. |
| Confidence | High, because the failure was reproduced. |
This format makes uncertainty visible and gives developers a specific failure to investigate, rather than a broad instruction to ‘fix rendering’.
Rendering matters beyond standard results
Access also affects newer search surfaces. A source must be crawled and eligible before its appearance can be measured, so the same caution used in AI citation measurement applies here. A visible outcome doesn’t reveal every system decision that came before it.
Reliable HTML, stable rules and accessible resources don’t guarantee inclusion. They do make possible causes easier to test and rule out.
A better starting question
Rather than asking ‘Can Google render this page?’, ask ‘At which gate does the page first stop matching the intended result?’ That question keeps the evidence in order, separates browser behaviour from crawler access and indexing, and gives the audit a clear next step. It also makes the finding easier to explain to a client or developer: you aren’t blaming JavaScript in general, you’re showing exactly where the expected page first changed.